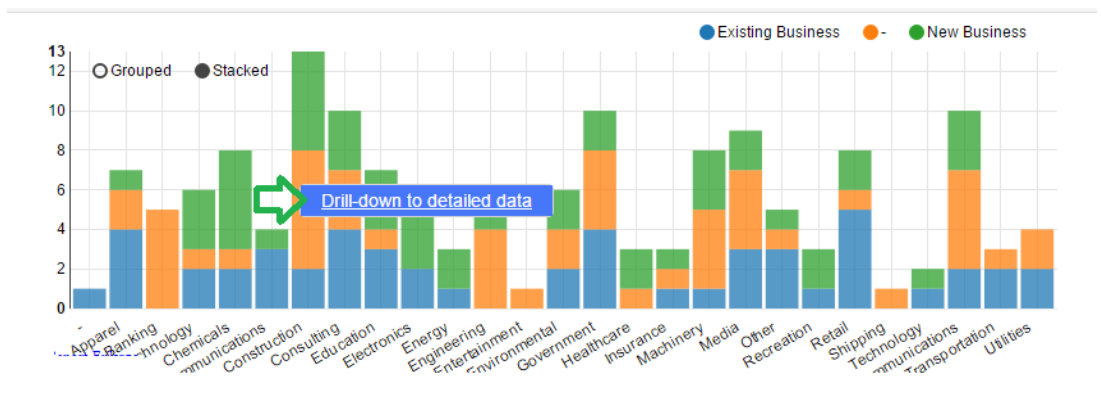
You can drill-down to the detailed data with a click to the chart area:
A report with detailed data represented by this chart area will open in a new browser tab.
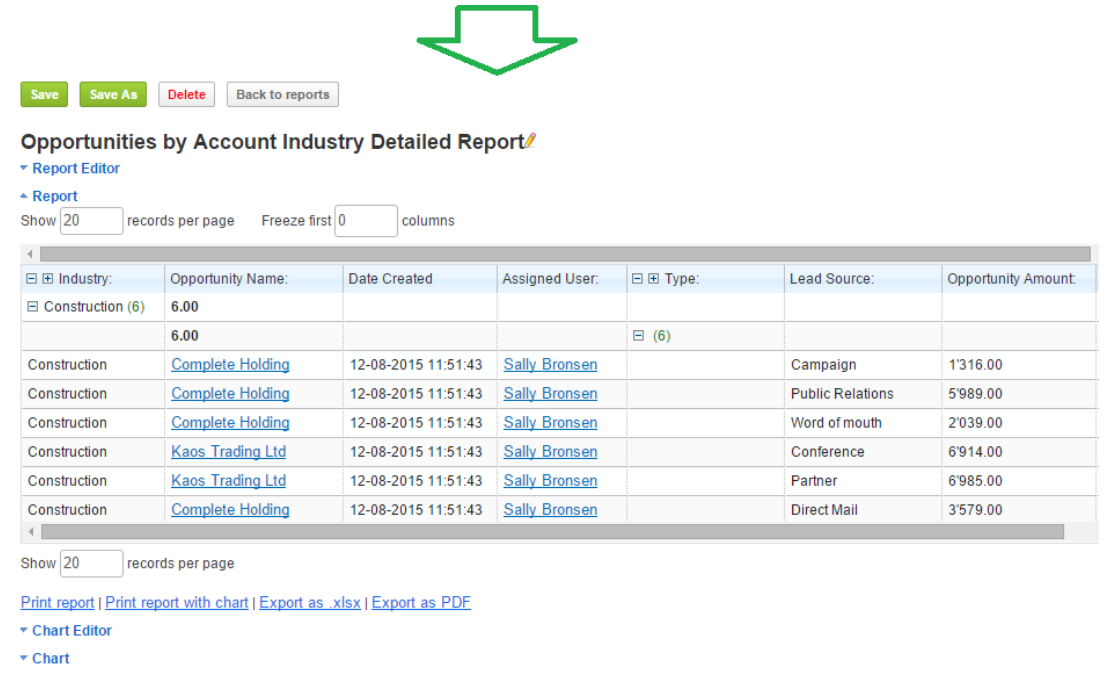
As you can see from the Screen-shot above, you can save the new detailed data as a report, export it, or use the report settings for additional filters or report layout changes, as well as to add the chart, if necessary.
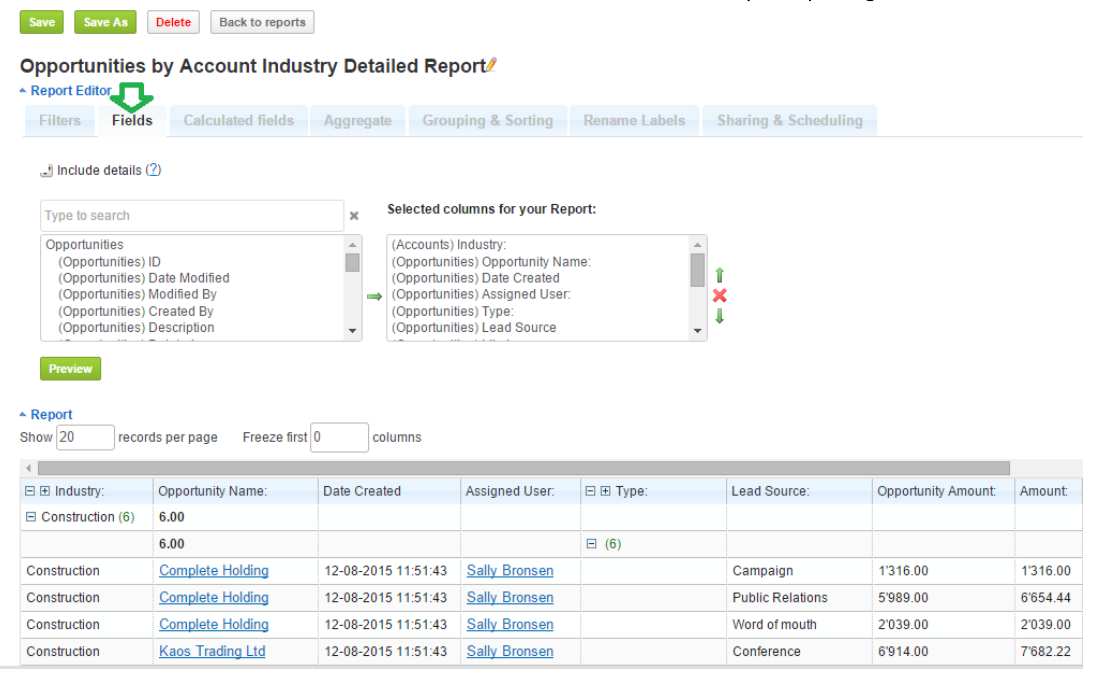
Whenever you create or edit any summary report, you can identify, what columns and in what order should be displayed upon drill-down. This can be done in the Report Editor Fields tab.
Drill down is available for both: Charts in the Home Dashlets and for Charts under the Report.
Drill down is not available for users who have no permission to drill-down the data. It is also not available for customized combined reports, Geographic Chart and Gauge Chart.
Change Chart Colors
In order to change the chart area colors, you should open the report containing your chart. Click any chart area to change its color and select the color from the color-picker located next to the Drill-down. Remember to save the report in order to update the chart with the new colors.
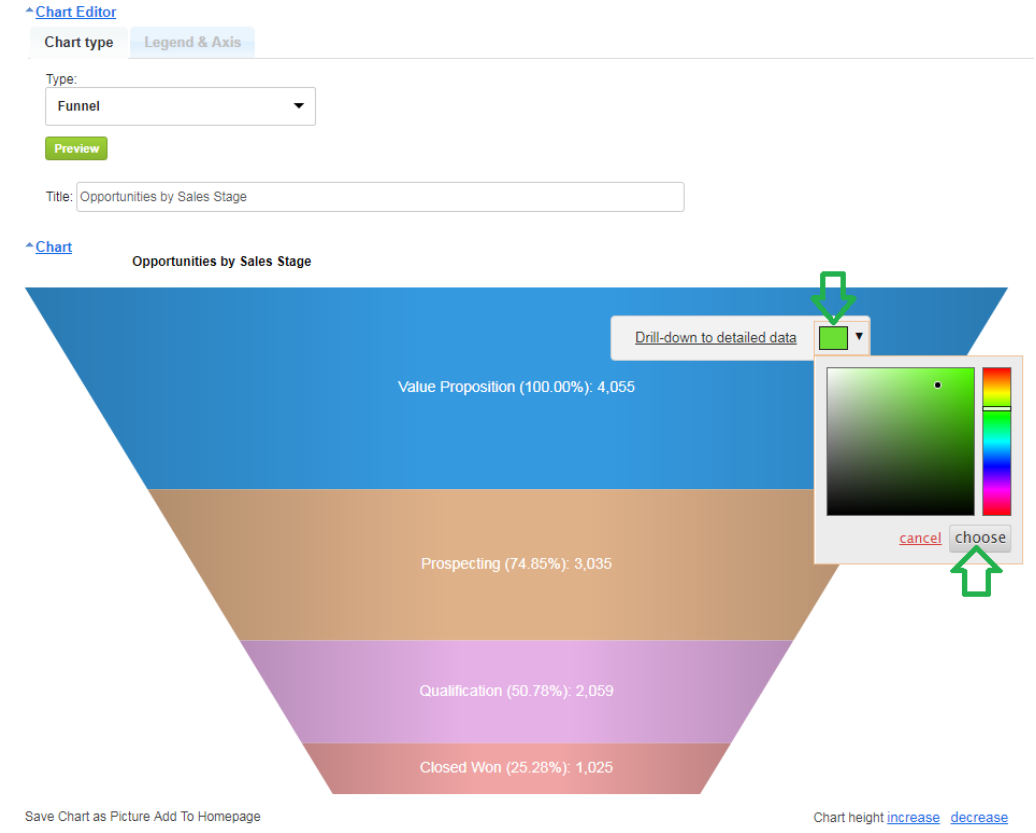
If you change the chart type, colors that have been set previously will be remembered across all charts if the names are the same.