After you have selected the necessary Columns(fields) and summaries in your Report, you can identify how data should be grouped and sorted – under the Grouping and Sorting tab.
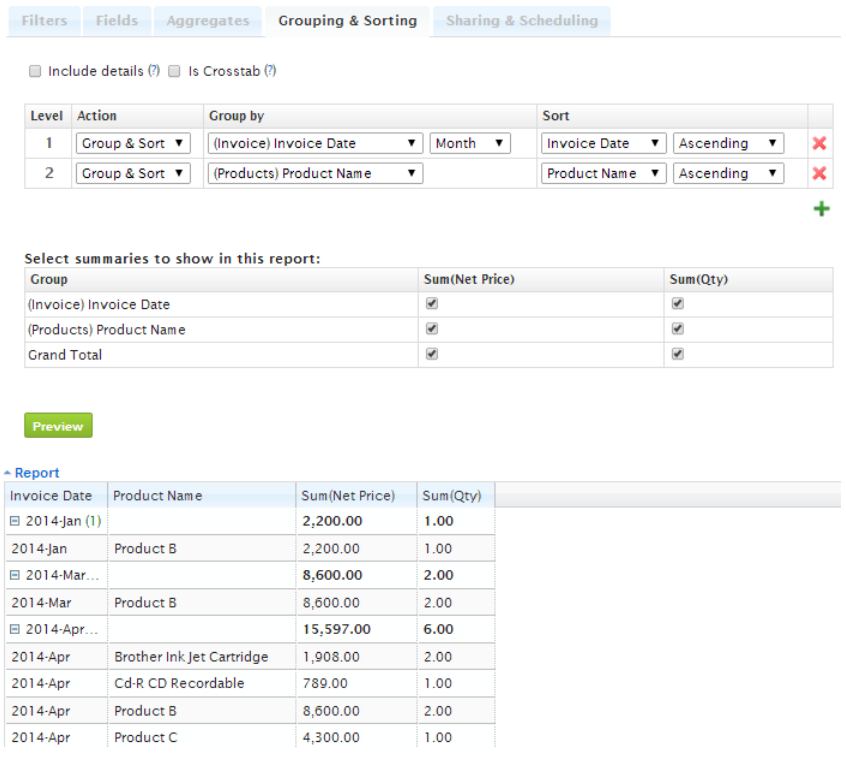
In the Grouping & sorting upper table in Group by select the field from the drop-down menu by which the data should be grouped and summarized in our Report. The drop-down menu contains only those fields which are selected under Fields tab. You can have several grouping levels in your report. The order of selected fields is replicated in your report. The first selected group (in the first row) is the upper level of the grouping and summarizing in your report, the Level number is 1. The next summary you add (Level 2) will be summarized already inside the 1st group. For example, if we want to see in our report Invoice amounts by Date and then by Product, we select date first and Product name second (please see the picture below). If you need to have this field grouped for summary, it is important to choose Group or Group and sort in the Action pick-list.
Group and sort and Sort options will allow you to identify the sort order in the Sort column: Ascending or Descending. If your report has selected Aggregates for summaries (under Aggregates tab), for the Group and sort option you can also choose to sort by this summary aggregate, for example, if you would like to sort not by Product name, but by product sold amounts.
For detailed reports (if Include details is checked) you can also select only to sort by this column. For more information about Include details please see the previous section How to set columns to sum, calculate average values or count? – Analytic Reporting Tool.
For date and date-time fields we can identify one of the following grouping levels: Day, Week, Month, Quarter, Year. In our example below we have selected to group and sort by Month of the Invoice date. In Sort selection you can identify the sort order (Ascending/ Descending) and also – do you want to sort by the group (in Alphabetic order) or by Sums in this group. For example, if you want to see the the month with the largest income from invoices first, you need to select Sum(Net Price)+Descending in sort options. In our example we want this to be sorted in calendar order, not by amounts, so we select the Invoice Date Ascending.
The green “+” adds one more grouping level and the red x removes it.
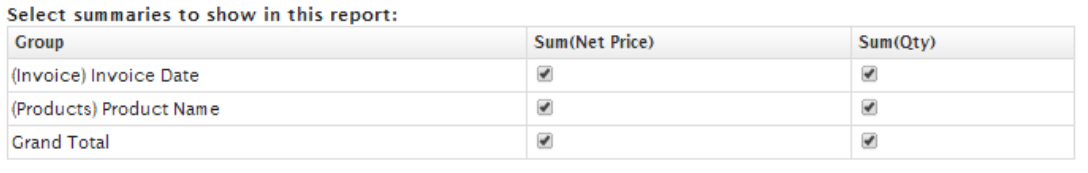
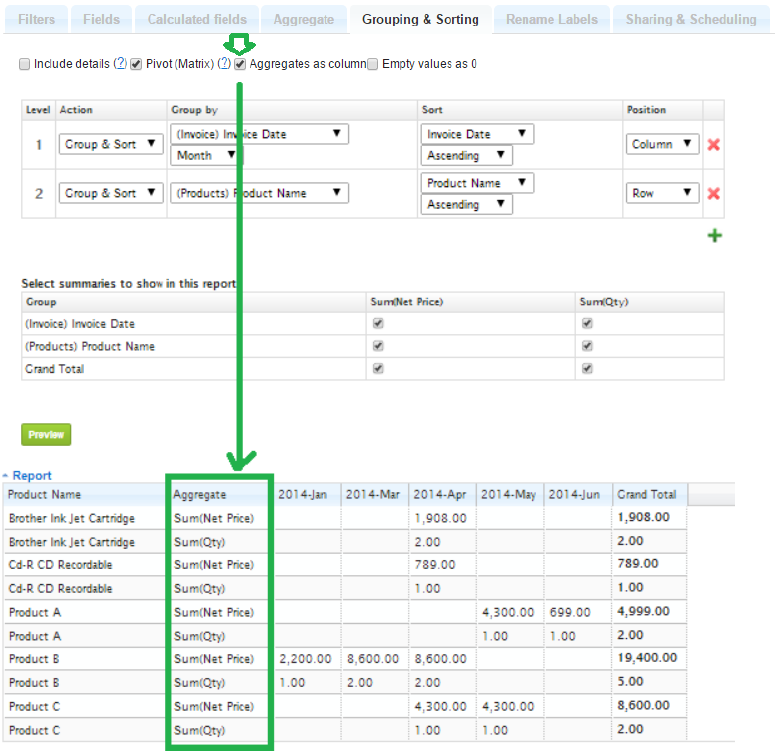
After the Grouping and Sorting options is the Select summaries to show in this report: table to select where we want our summaries to be shown/hided. In our case we have selected to show selected summaries for all our groups and to display the Grand total as well:
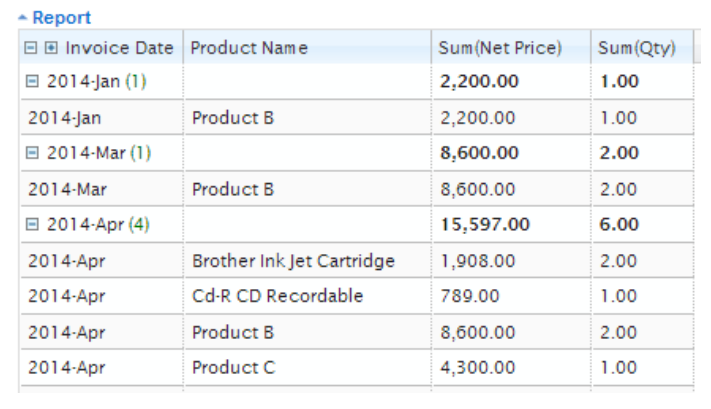
When our grouping options are set, we can click Preview button to see the result:
If you want to see the group items each as a new column (instead of row), you should select the check-box for Pivot (Matrix). As soon as Pivot (Matrix) check-box is selected, we see additional options in our Grouping and sorting table: Position. Here we need to select at least one group item that should be organized as a Column. In our case it is Invoice Date, while Product name will be as Row.
In our example, we want to see each month in a new column. We select the Pivot (Matrix) check-box, set Column next to Invoice Date and click Preview. Now our report looks different:
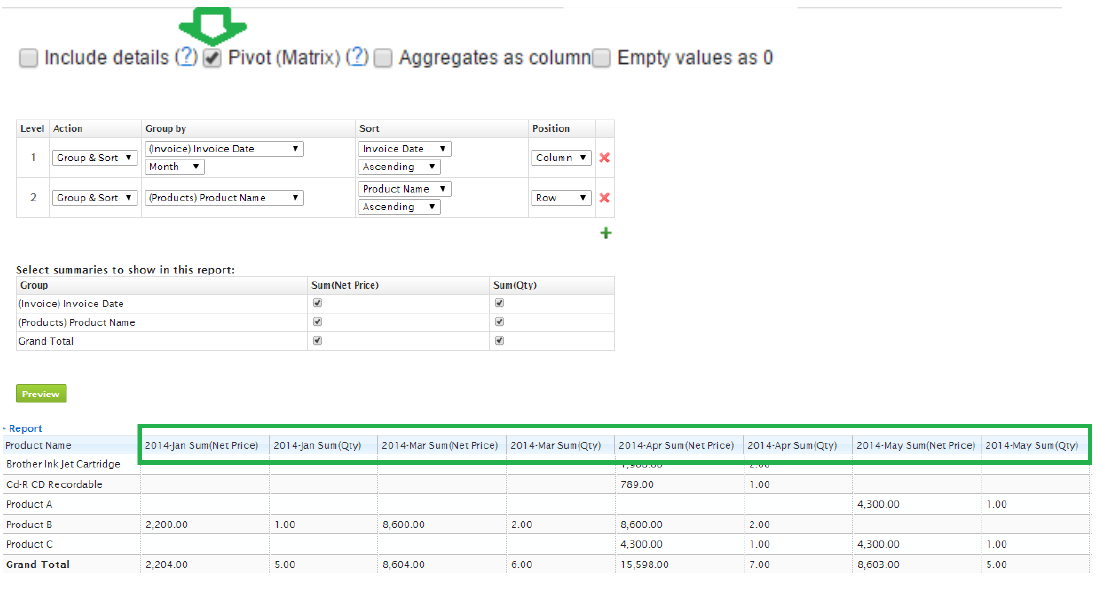
However, since we have two aggregates: Sum of Net Price and Sum of Quantity, each column for each month is shown twice (additional column per aggregate within each month) and our report looks unnecessarily large. To solve this, we can select Aggregates as column and we get:
Each month now has only one column, but Sum of Net Price and Sum of Quantity are organized as rows in our report.
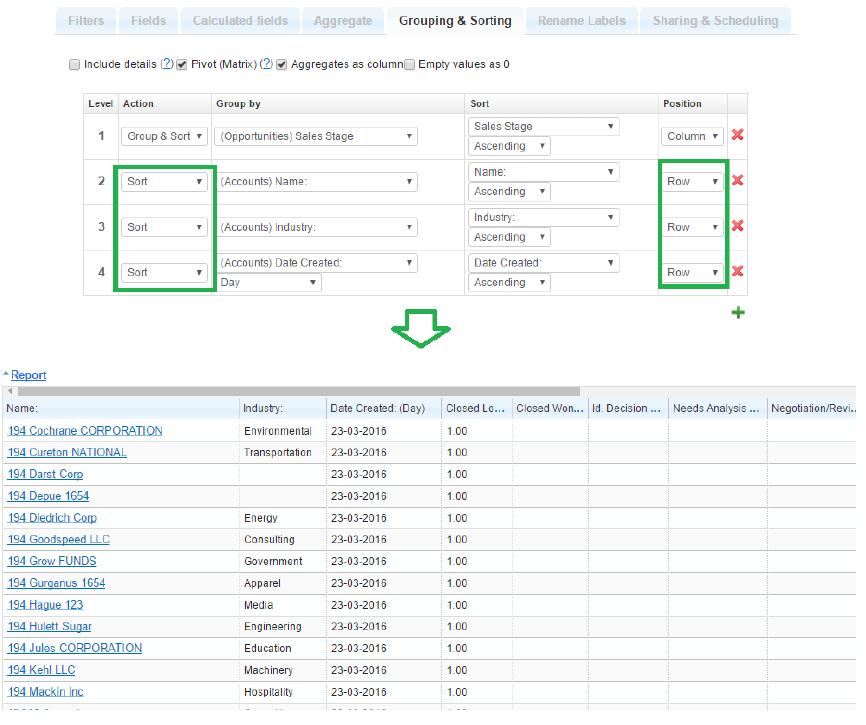
Sometimes it is necessary to see detailed data together with summary pivot view in the same report. For example, if you need to see Account details, Name, created date, Industry in each row and then summary by Opportunity Stage as a matrix, then just select Pivot (Matrix) check-box again, and for detailed entries identify as sort and row – please see the sample below:
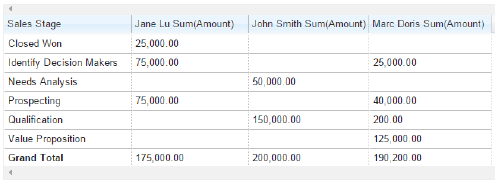
For Pivot types of reports, empty summary values are displayed empty by default like this:
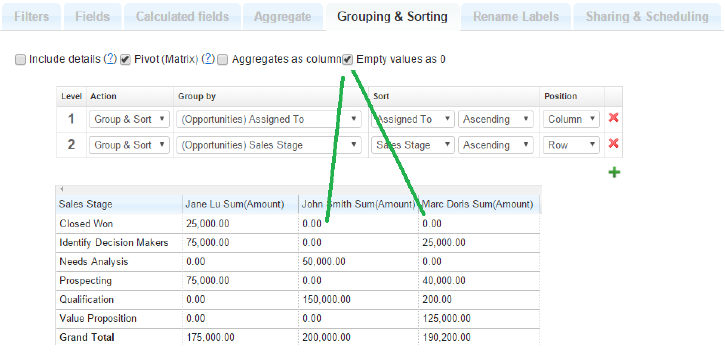
In some cases it is preferred to show empty values as 0 instead, for example, for exporting to Excel. This can be achieved by selecting the Empty values as 0 check-box under Grouping & Sorting tab.
Please note that Pivot (Matrix) is not available if you have selected Include details.
Remember to save the selected Grouping and Sorting changes. If you are not sure, if you want to Save the changed Grouping and sorting settings, you can preview and close the report without saving. You can also use the Save as option to keep the current report without changes and play with the new report at the same time.
NOTE: If you are using the Leads module, it might be interesting for you to compare unconverted leads versus converted leads. In order to do that, you can select field Converted and then Group by this field.
Detailed info on top first/last grouped items
There are cases when you need to see detailed information of the first or last activity or opportunity by customer or by user, for example. Till now, if you could group by User, Customer etc., then you could either see all detailed information of all activities (without the option to filter first/last) or you could see the first/last date of the activity, opportunity or other (or any other min/max value), but there was no way to see detailed information, like Subject, description etc. of this first/last entry.
You can select to filter one or several first/last/min/max grouped entries.
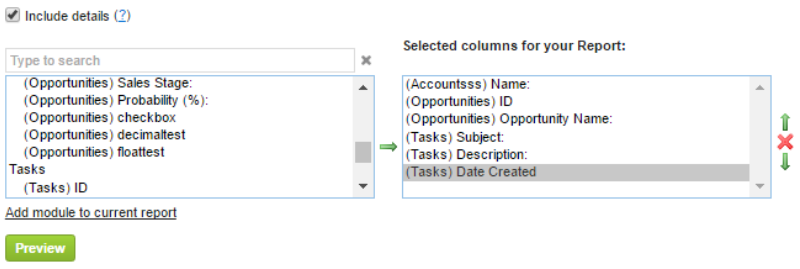
In our example we want to see the last task information for each opportunity. We need to see Account Name, Opportunity name, Opportunity ID and Task Subject, Description and Date Created. In order to do this,
1. We select the necessary fields under Fields tab and keep Include details checked.
2. Under Grouping and sorting we first select to group by Opportunity ID field and then for the second level Group & sort option – Task Date Created. We select Descending to see the most recent dates (or Ascending if we wished to see the first or oldest ones). Define the number of Show Top entries. Type 1 if you need to see only the latest detailed Task information by each Opportunity.
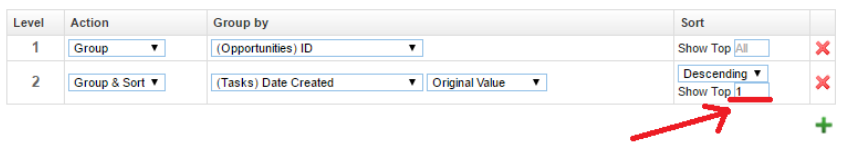
You can choose any value for Show Top in case you wish to see several last activities by opportunity.
Grouping and sorting for multi-select pick-lists
If you have a multi-select pick-list and have selected several pick-list values for each e.g. Organization and you still want to see how many Organizations have selected each value, you can choose the option Separate each value (on demo versions you will see a Report Organization-Product Multi Select test in the Test folder):
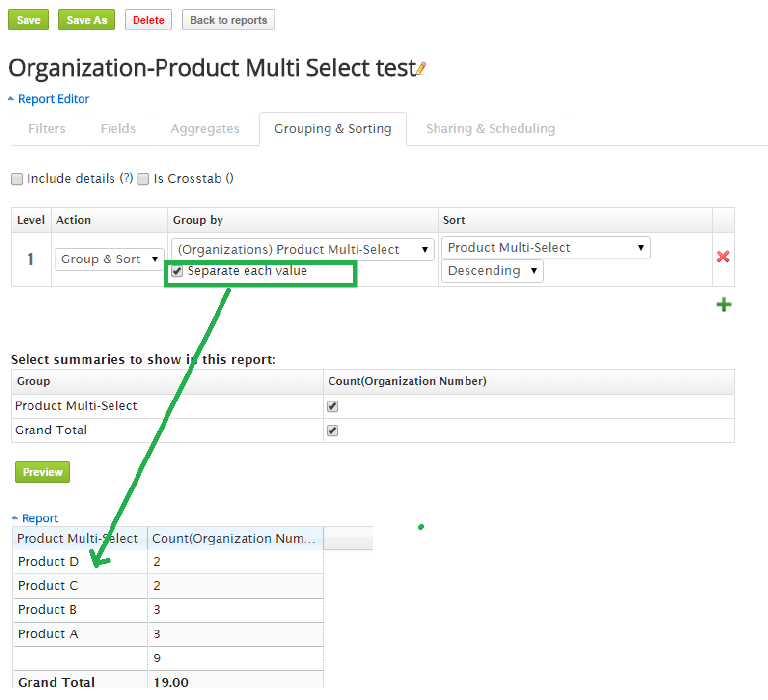
If you would like to see how many organizations have selected a combination of certain pick-list values, you simply need to deselect the check-box Separate each value.
Calculate % from Total
It is possible to calculate % from total, if you have detailed or summary report with Groups and Aggregates. You should have at least one aggregate selected under Aggregates tab and at least one Group added under Grouping & Sorting tab, with action identified either as Group & Sort or Group. (If the Action is set to Sort, there will be no option for % calculation).
Now under Grouping & Sorting tab in the lower table of settings Select summaries to show in this report: you should select the check-box for the necessary Aggregate, which you want to calculate % for and then in the drop-down you should select % from total.
IMPORTANT: Please note that Grand Total also must be selected, since we need to know it in order to be able to calculate %.
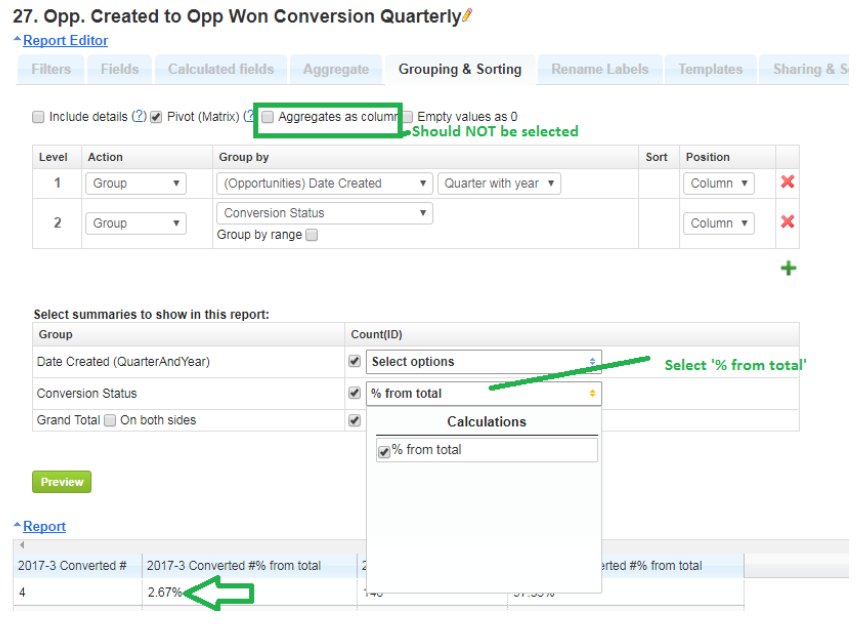
On Preview or after report Save with the new settings you will see a new column showing the calculated %.
% Calculations are available in Detailed, Simple Summary and Pivot (Matrix) report types.
Currently this functionality does not support Aggregates as column, which means that this check-box should stay unchecked.
Identify Your Own Ranges for Report Summaries
In some cases it is necessary to split your summary reports in certain ranges. For example, if you need to see how many deals do you have for up to $100k; how many between $100 -$200k etc.
There is another case, often used for KPI reporting, when you set certain goals to be reached monthly or quarterly by your sales agents. This is a bit different case, as here you need to see, how total count or sum of an amount for each time period is allocated for each individual.
Analytic Reporting Tool PRO has now the solution for all of these cases!
Let’s start with the most simple case, where you need to see how many opportunities have converted amount of up to $100k, how many between $100 – $200k and how many exceed $200k.
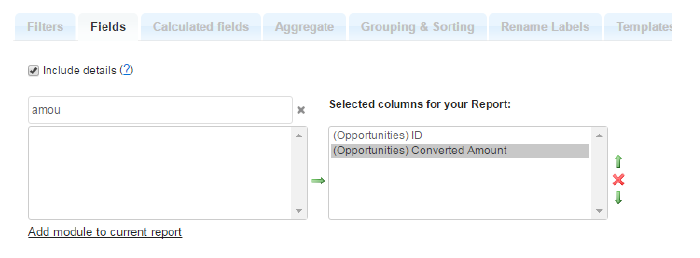
First of all you need to have opportunities added to your report and under Fields tab let’s select Id for counting and Converted amount for our ranges.
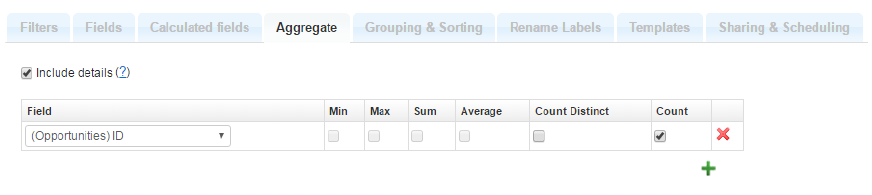
Under Aggregate let’s select Id to be counted
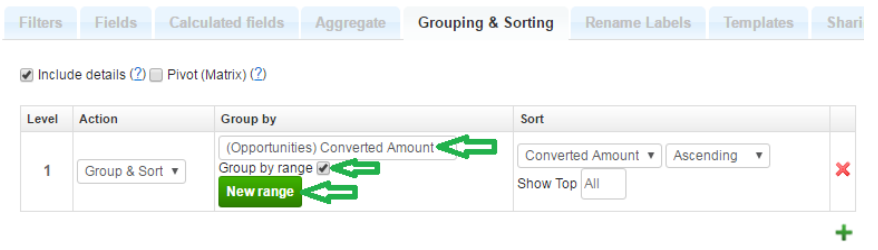
Grouping & Sorting tab is where you actually set your ranges.
1. After you select any of the Amounts under ‘Group by’, the check-box of Group by range will appear. (Be aware that Group by range appears only if the numeric type field is selected, it will not be available for other field types, like text fields and dates.)
2. You need to select the check-box in order to set your ranges. New range button will appear. Click to the button in order to add a new range:
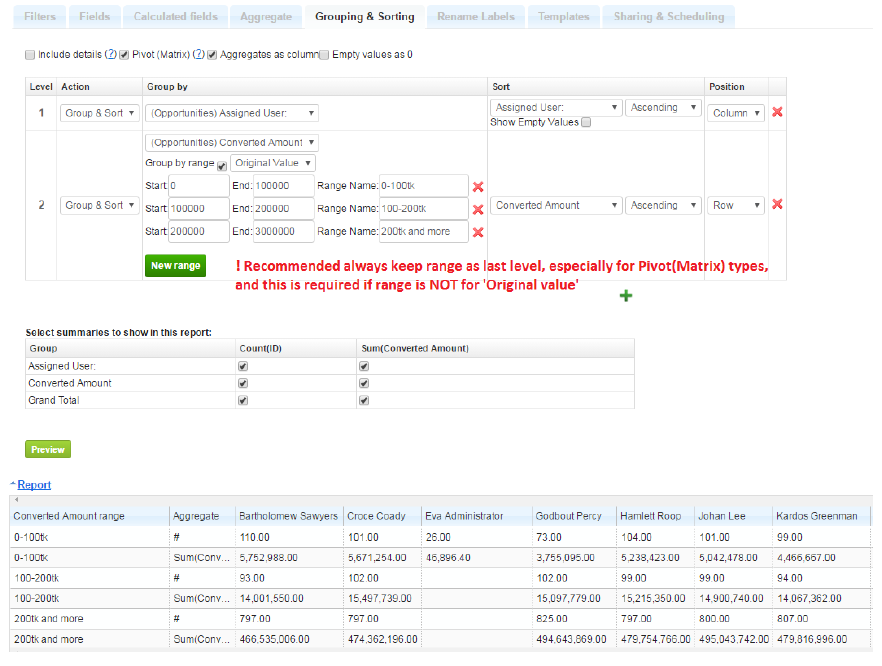
3. Now you can identify each range, by entering the amount to start and end with and name your ranges for a better looking report. Returned values will be inclusive, e.g. first range in our sample will include 0 and 100k amount opportunities; second range will not include 100k opportunities, because it is already grouped in the first range. Click Preview to see the result of your settings.
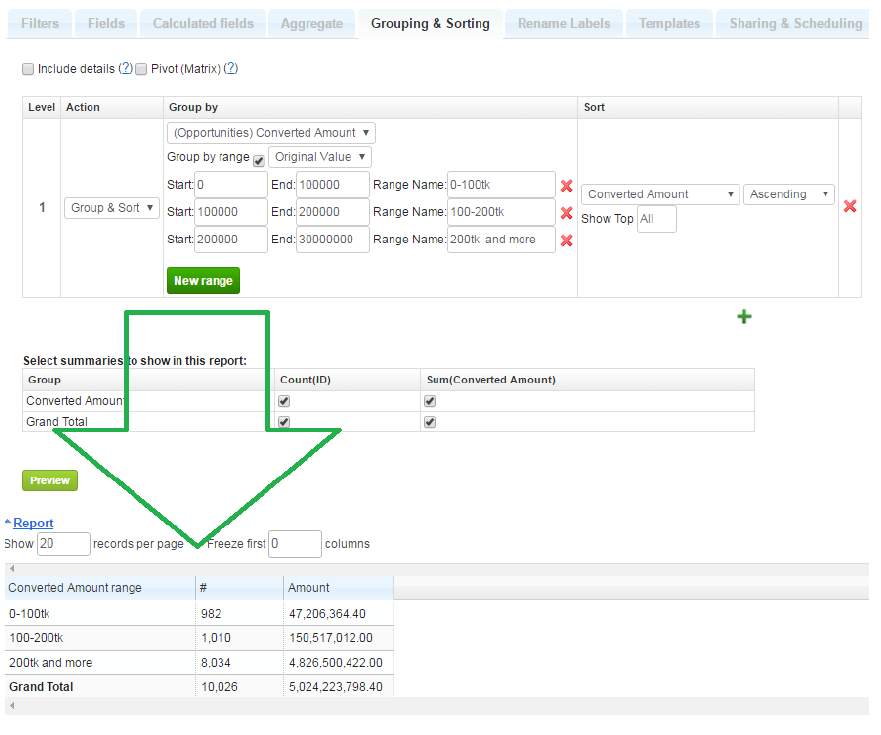
In this example we can see that we have 982 Opportunities with a converted amount between 0 and 100k and their total converted amount is 47’206’364.40; 1010 opportunities with amount between 100 and 200k etc.
4. If we want, under Grouping & Sorting tab we can also add grouping by month and/or by user etc. – same way as usually.
Ranges for aggregated values (i.e. summarized, counted values, etc.)
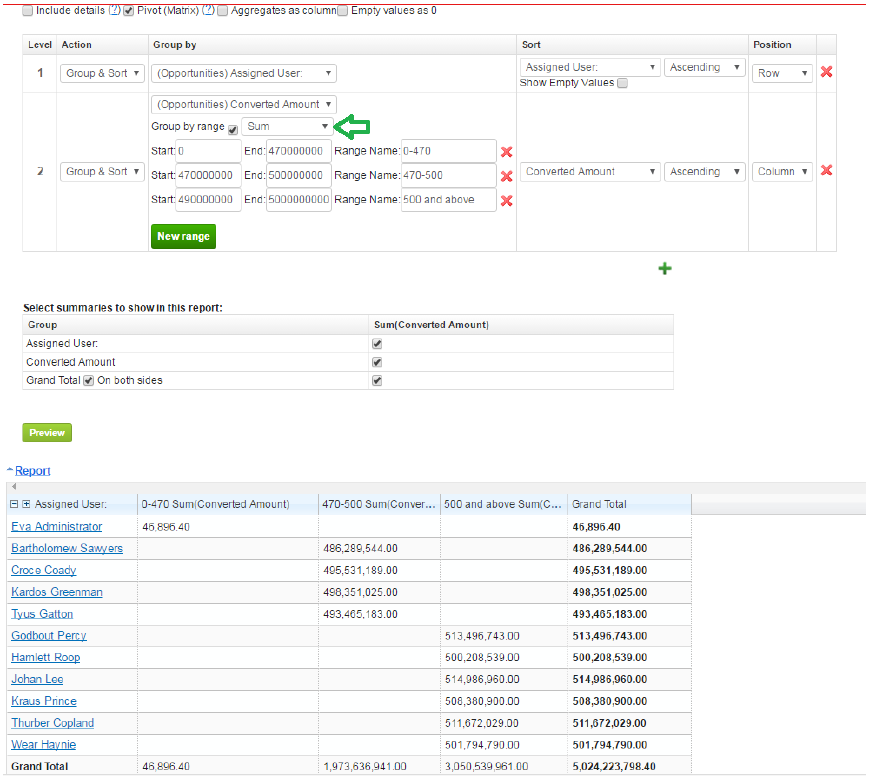
In our previous examples we added ranges for original values (i.e. for Converted Opportunity Amount). If we need to set ranges for already summarized or counted values, first of all, we need to identify the Group under Grouping & Sorting tab – Sum by User, Month or any other grouping. And only afterwards should we add another group for ranges, because the range of summarized values needs to know this option beforehand in order to perform correctly.
For example, if we want to see which Sales representatives have reached the target of total opportunity amount, which are below, and which ones have exceeded it, we can do the following:
1. First of all, we select User under Grouping & sorting as the first level; next level will be for ranges.
2. We should select a numeric field type and then Group by range check-box will appear, this should be selected. In our case we will add ranges to Sum of Converted Amount.
3. We need to select Sum (if we want add ranges for Count or other, we can simply select Count here.
4. Identify ranges and their names (red x is there to remove unnecessary ranges, if needed).
5. Preview to see the result (remember to Save / Save as if the result is as expected).
Grouping order matters!
If your report is not a Pivot(Matrix) type and you need ranges for the original values, you can simply add User or Month grouping as the next item under Grouping & Sorting tab.
However, if this is a Pivot (Matrix) type and also, if you need to have ranges for already summarized or counted values, you should always keep the range as the last item in the ‘Grouping & Sorting’ tab table.