Advanced Open Reports
Advanced Open Reports (AOR) are the reporting module within SuiteCRM. You can access AOR by clicking on the Reports link in the navigation menu. The reporting module allows users to report CRM data from any module and has many features to quickly display key information.
Creating reports
To create a report, move the cursor over the Reports module in the navigation bar and select Create Report.
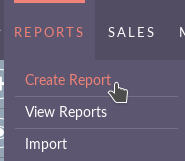
You will be presented with the Edit View report. To obtain a list of fields to add to the report, you must select a module from the report drop-down menu.

Add fields
Once you have selected a Report Module, the list of available fields will be displayed in the left panel. You can add fields in the Fields section of the report by expanding the module from which you want to select fields and then drag and drop those fields in the field section.
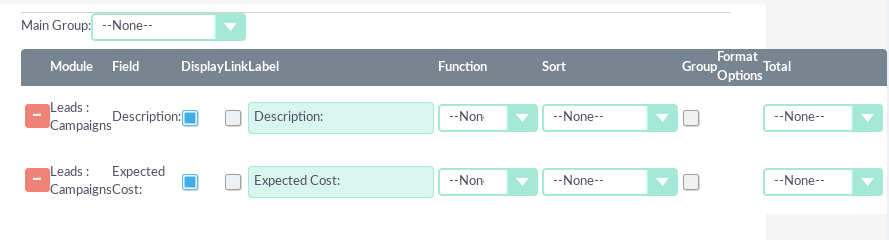
Once you have added the fields to a Report, there are several options to configure for those fields:
– Screen – True or false option. Allows you to specify whether this field should be displayed in the report or hidden. Users may want to add fields to perform a function but may not want to show this in the report.
– Link – True or false option. It allows you to make the field a link. Setting this option to true will link the field in the Report Details View, which will allow you to click on the record. This will guide you to the proper record. For example, linking the Opportunity Name will take you to the Detailed View of that Opportunity.
– Label – this is the label that will be displayed for the column / field in the report. You can change the label from the default value to any alphanumeric value.
– Function – provides five options: count, minimum, maximum, sum and average. It allows you to perform functions in alphanumeric fields. Users may wish to calculate the average opportunity amount or count the total opportunities in a given sale stage.
– Sort – Ascending or Descending. It allows you to select whether you want to sort the field / column by descending or ascending. This can be done for all fields.
– Group – True or false option. It allows you to group by this field. For example, you may want to group by sales stage when reporting an opportunity.
– Total – provides three options: count, sum and average. This allows users to perform total calculations in numeric fields. This is useful for financial reports, such as the total value of all Opportunities in a certain stage of sales.
Add conditions
Once you have added the fields to your Report, you can add condition lines to the Report. You can add conditions with the same procedure as adding fields. Using the drag & drop functionality, you can drag fields to the Conditions area that the field will add and allow you to specify the condition for that field.
Charts
You can add tables to Reports. The graphics provide a visual representation of the data in the Report. In some scenarios, or for particular users, visual aids such as graphics can help a faster analysis and better understanding.
Types of Charts
There are six types of charts that the user can select to display the data in the report. These are:
-Pie chart
-Bar graphic
-Line chart
-Radar chart
-Back stacked
-Bar grouped
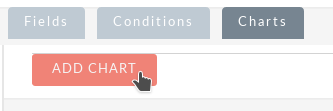
To add a chart, you can click the Add chart button, under the Conditions section within the Report Edit View.
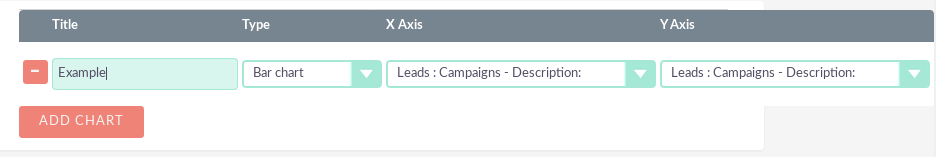
Once you click on add chart, you will be presented with the option to specify the following information:
– Title: allows the user to specify the title of the graphic. This will be shown in the detail view of the report and also in the dashlet chart.
– Type: allows the user to select one of the six types of graphics detailed above.
– X Axis: allows the user to select the column that should be used for the X axis.
– Y Axis: allows the user to select the column that should be used for the Y axis.
Once you have specified the details of the chart, save the Report. This will display the box in the details view of the report, below the list of returned records.
Reports Dashlets
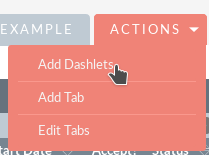
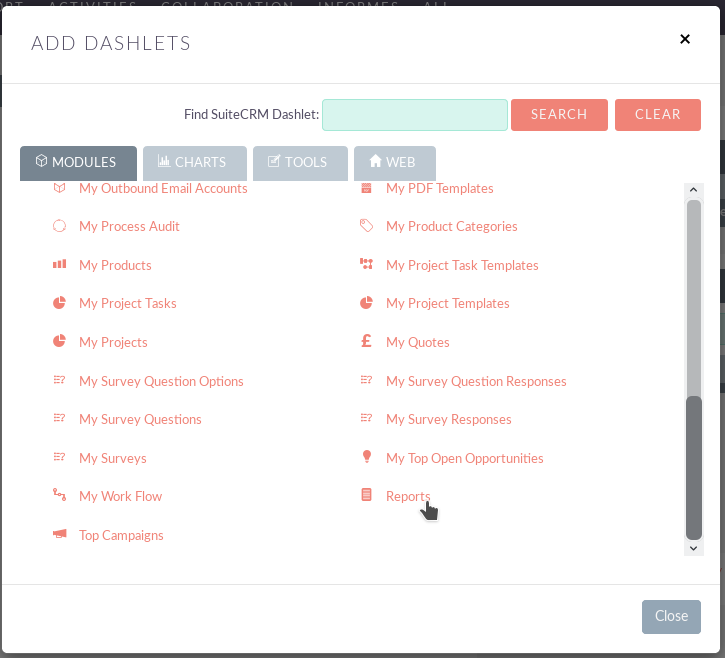
You can display a Report within a dashlet. It is possible to see multiple report results since you can add multiple report dashlets and select different reports within each dashlet. To do this, add the Reports dashlet to your home page.
Once you have added the dashlet, you must select the Report you want to show inside the dashlet. To do this, click on the pencil icon to edit the dashlet.
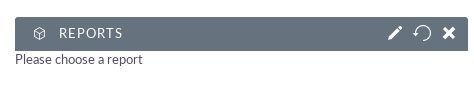
This allows the user to select the Report that he wants to show inside the dashlet.

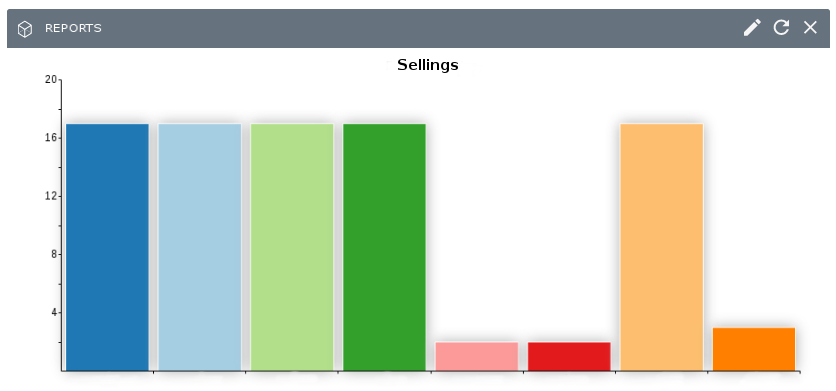
Once you have selected the Report, click Save. This will update your Reports dashlet to show the results of the Report.
NOTE: For more information about adding and managing dashlets, see the Dashlets section of this user guide.
Reports Dashlets Graphics
You can specify that you only select to display a graph for the Report dashlets. To do so, edit your Report dashlet and select the Only show charts option. This will display a list of all the graphs you created for this Report.
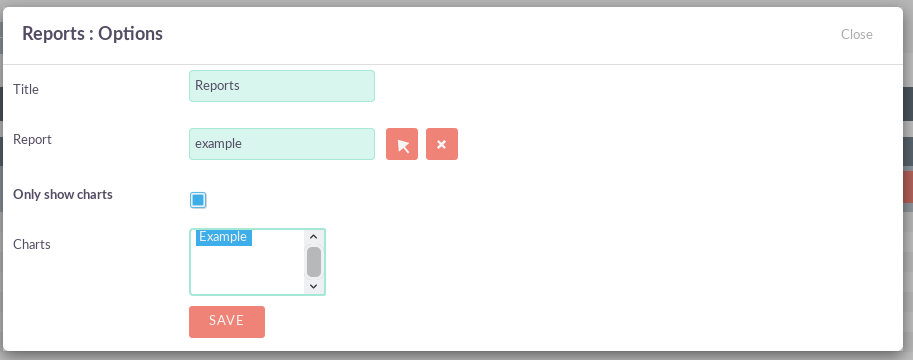
Select a chart or multiple charts and click Save. This will display the results in the selected box.
Scheduled reports
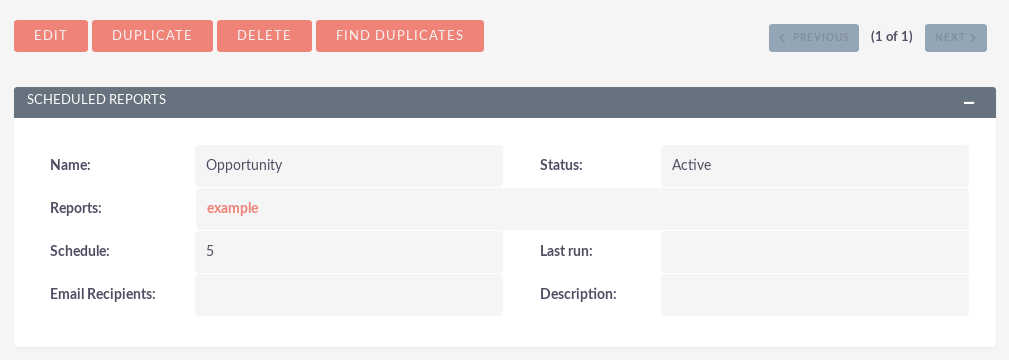
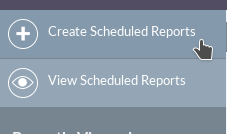
You can schedule reports to run automatically and send them via email to the required contacts. This allows users to schedule reports that are sent to managers or team leaders either daily, weekly or monthly. To create a Scheduled Report, you can click on the Create option in the Scheduled Reports subpanel in the Detailed View of the Report. You can also select existing Scheduled Reports to relate to the Report.
Once you have clicked Create, there are options to set for the Scheduled Report. Provide the scheduled report with a relevant name.
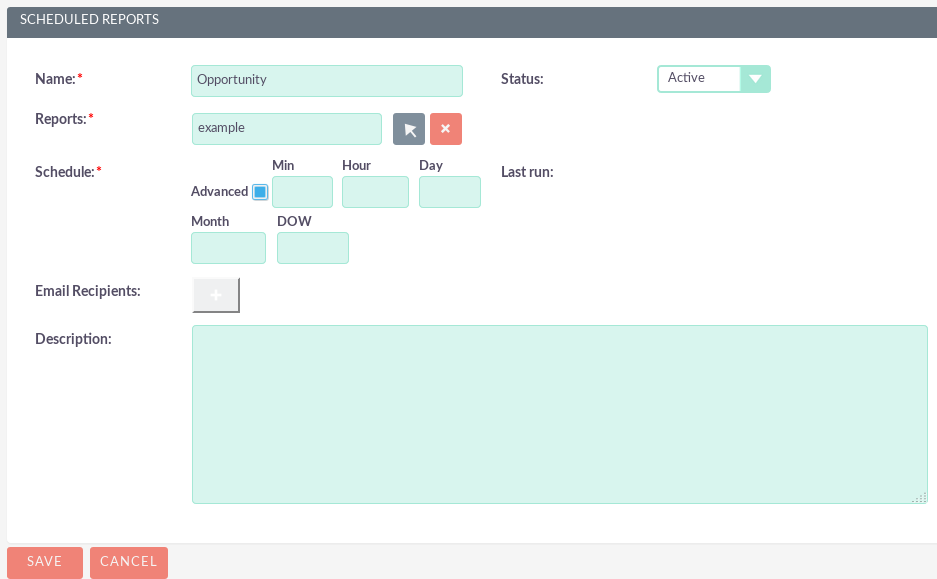
You can select the Advanced option for scheduling reports. This will provide a notation style option. This is more suitable for system administrators or advanced users.
Once you have entered a name and selected a timetable, click Save.
Once you save the scheduled Report record, Scheduled Reports will be displayed in the Detailed View of the Report in the secondary panel.
You can see when the scheduled report was last executed.