It is possible to create a Snapshot report for a given time period as well as periodically generate new snapshot data (i.e. by the end of each day, week or month). The Snapshot report is using data from Sugar history audit (this means that to keep track of changes – Audit History has to be enabled in Sugar via Sugar Module Builder).
If this is the first time you want to start using the Audit History data for Snapshot reports, you need to generate the necessary data first.
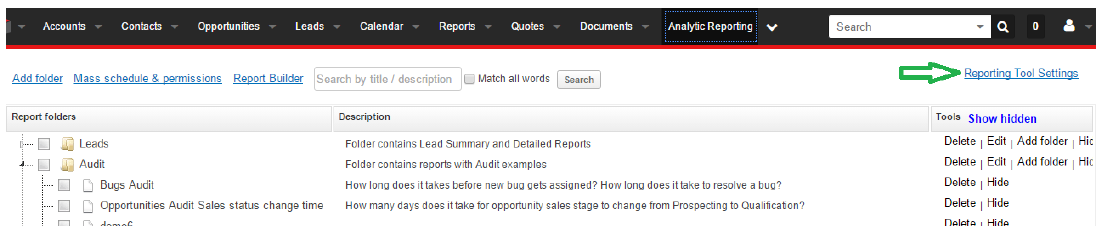
In order to do that, open the Reporting Tool Settings found in the top-right corner of the Analytic Reporting Tool report and folder list.
Please note that Reporting Tool Settings are available only for users with Admin privileges.
If necessary you can edit the process before running it under Processes:
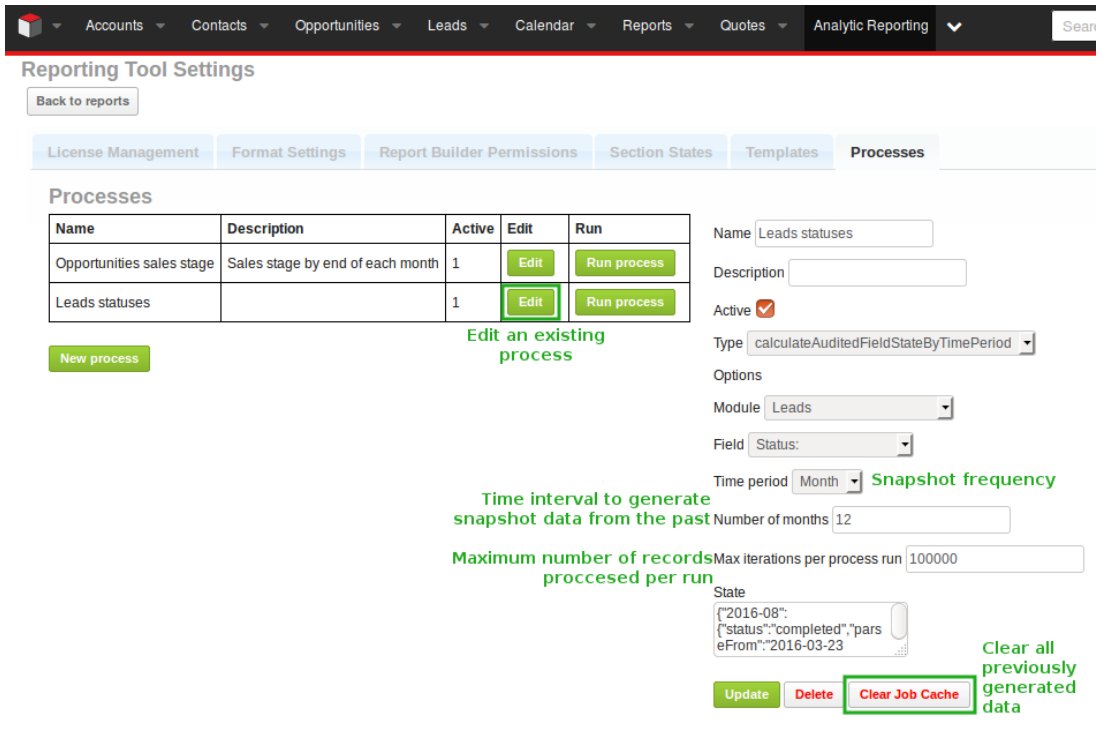
For the job type select calculate Audited Field State By Time Period as the other option calculate Audited Field State By Month is there only for backwards compatibility and can be considered redundant. Select the Module and Field of interest and choose the time period. The time period defines the snapshot frequency. A time period of Day will create snapshot data for each day. The Week and Month options will create snapshots at the end of each week and month respectively.
Click Run process in order to create historical data for a given time period. The following example will create leads with leads statuses at the end of each month.
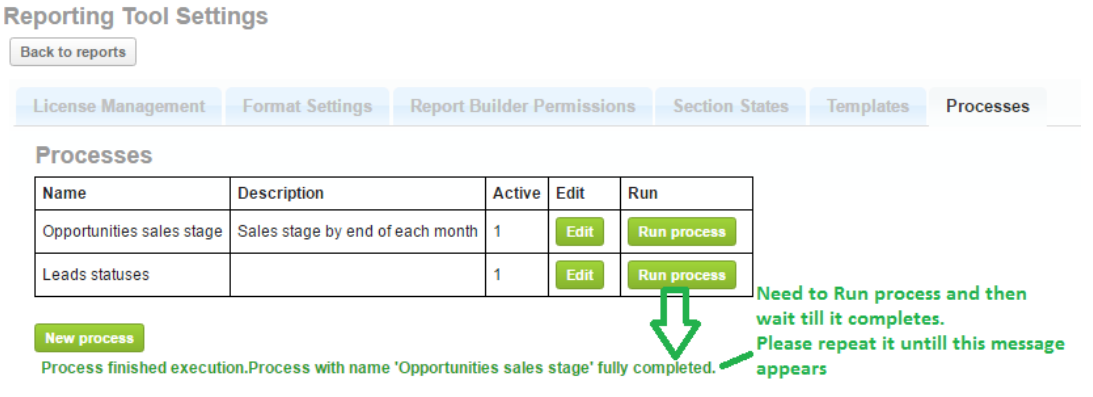
In the case of lots of data, you might need to run the process several times by clicking the same button Run process again until the following green text appears: Process finished execution.
On a more technical level Max iterations per process defines the maximum number of records from the audit tables processed each run to create snapshot data. This setting can prevent the process from timing out on a lot of unprocessed audit data. This is why it might be necessary to run the process repeatedly initially. However, once all the initial snapshot data is generated and schedulers are set up data will be generated continuously. For instructions setting up the Scheduler see below.
Once the initial data is generated it is necessary to set up a Scheduler to automate continuous snapshot data generation. To set up a scheduler go to the Admin panel and select Scheduler. Select the Analytic Reporting Processes job and choose a Job Name and interval settings most suitable to you and save the scheduled job. Once this is done everything is set up to start using the Snapshot report.
Go to the Report Builder and create your Snapshot report as any other report – select the report folder, enter the preferred report name and description, keep the report type Standard and then select the necessary module.
It is important to remember to select Add custom tables check-box, as you can see in the example below:
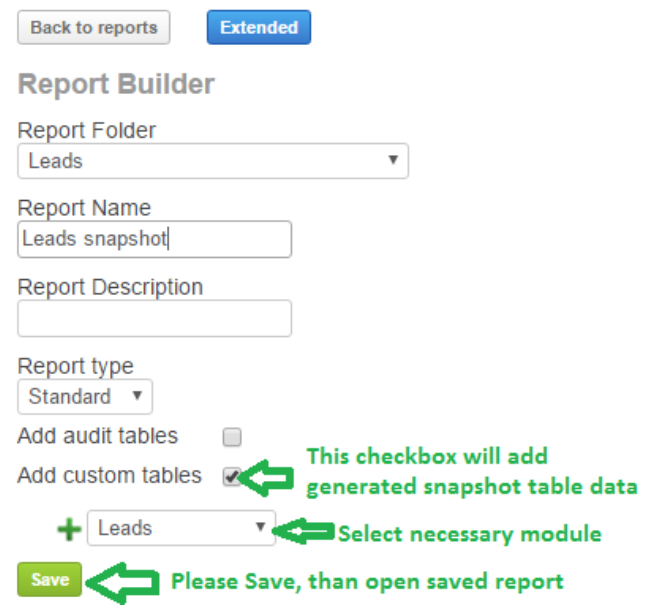
Save and open your new report.
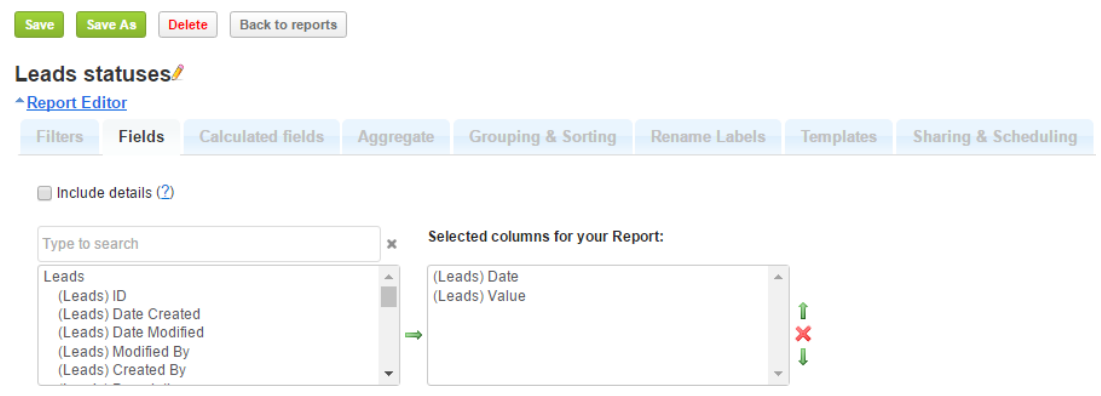
Under the Fields tab please select the fields Date and Value – those are the names of the generated snapshot data and can be found in the fields list under the Snapshot category.
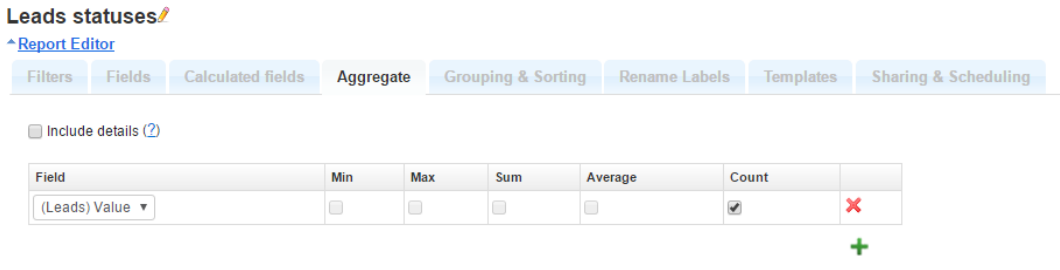
Under Aggregate please select Leads(Value) to Count.
Under Grouping & Sorting select the grouping and sorting options for your summary report according to example below:
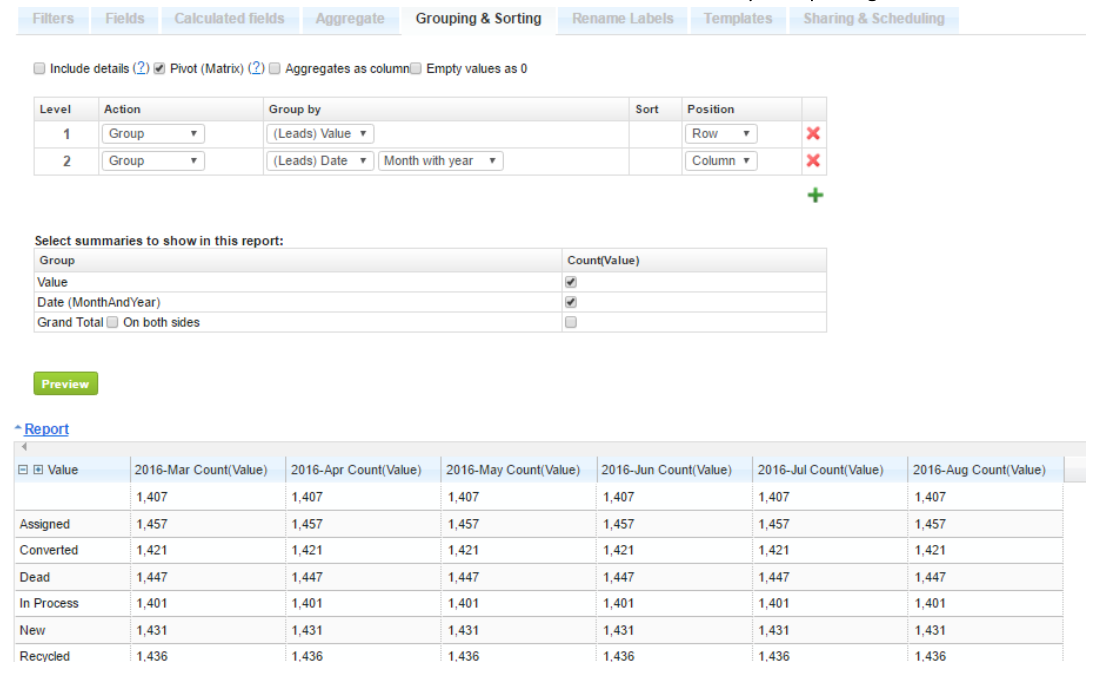
The summary report is now ready for use.
Continuing with our Lead status report we will create a chart for our report as well. In this example we will create an Area Chart that illustrates the changes in Lead statuses over the course of time.
For the horizontal axis and legend we choose the Date Month with year grouping and for the vertical axis the value count aggregate. Since the Value grouping we have defined we will get nice data series for each individual Lead status.